
Estimation of Vertical Uncertainties in VDatum
 Accuracy of Transformation
Accuracy of the Source Data
Other Considerations
Accuracy of Transformation Between NAVD 88 - NGVD 29
Topography of the Sea Surface Accuracy
Tidal Transformation Accuracy
Tidal Datum Accuracy
References

Users of VDatum should be aware of the potential uncertainties, or errors, in computed heights when applying the software to convert values between vertical datums. Random errors in VDatum may arise from inaccuracies in either the gridded fields employed in the datum transformations, such as GEOID03 or the Mean Sea Level (MSL)-to-Mean Higher High Water (MHHW) transformation, or in the source observational data used to create VDatum, such as the elevation of the tidal datums or the height of the North American Vertical Datum of 1988 (NAVD 88). The user should also be aware of the existence of measurement errors in his or her own vertical elevation data, i.e. uncertainties related to bathymetric measurement, GPS measurement, leveling, etc.
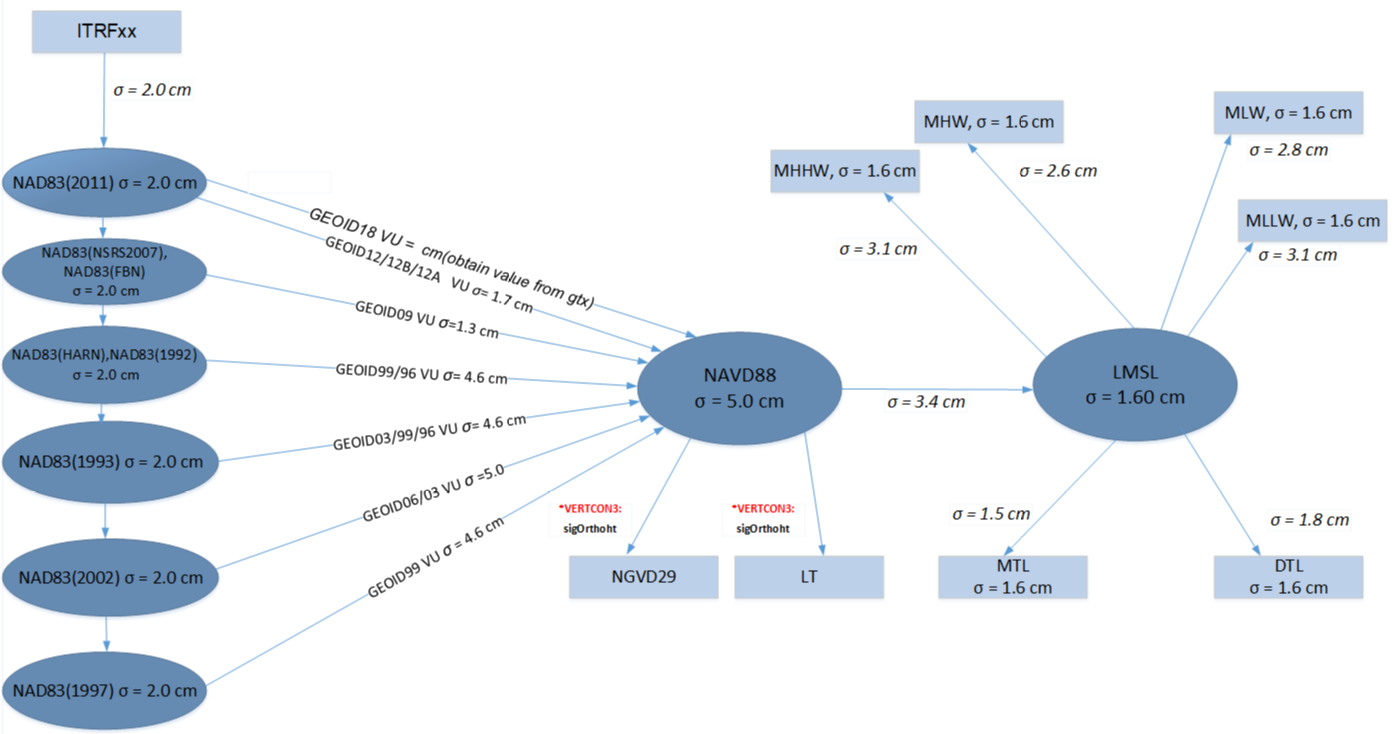
For the evaluation of VDatum, the standard deviation (SD) is the primary statistical variable used to quantify the random uncertainty in both the vertical datums (i.e., the source data) and of the transformations between them. Standard deviation is a simple measure of the average size of the errors in a data set (when errors are normally distributed). Uncertainties for the source data and transformations in the Chesapeake Bay VDatum region are shown in Figure 1 as an example.
Total random uncertainty for a sequence of conversions such as those used in VDatum is obtained by taking the square root of the sum of the squares of the individual uncertainties. Total uncertainty also includes systematic errors such as those due to land subsidence or sea level rise (The present study currently does not include these systematic errors.). A preliminary assessment of VDatum uncertainty, using the Chesapeake Bay region as an example (see the schematic figure, below), reveals that the uncertainty due to only the transformations from the International Terrestrial Reference Frame of year XX (ITRFxx) through the North American Datum of 1983 (NAD 83), NAVD 88, and Local Mean Sea Level (LMSL) to a tidal datum (i.e., MHHW) can be as large as 7.1 cm (the maximum in Chesapeake Bay occurs when the tidal conversion is to either MHHW or MLLW). An explanation of how this number was computed appears in the Accuracy of Transformations section below. In addition, the uncertainty due to only the source data is 5.84 cm. An explanation of how this number was computed appears in the Accuracy of the Source Data section below. Thus, the maximum cumulative uncertainty, obtained by taking the square root of the sum of the squares of the individual uncertainties, is approximately 9.2 cm (7.1^2 + 5.84^2 = 84.52 = 9.2^2). It should be noted that the estimate of errors described above does not include the use of NGVD 29 data. These data have much larger uncertainties as can be seen in the diagram above.
Figure 1. Schematic showing how VDatum handles the transformation (arrows) of a value from an ITRFxx ellipsoid to several vertical datums (boxes) through the core datums (ovals). Estimated errors in the transformations for the Chesapeake Bay VDatum region are shown as standard deviation values (SD) and are placed next to the arrow relating to each transformation. Also included are the estimated uncertainties for each individual vertical datum, shown as the SD values inside the ovals/boxes.
The maximum cumulative uncertainty (MCU) is the value of cumulative uncertainty for the transformation from ITRFxx to the tidal datum whose transformation has the greatest uncertainty. For the Chesapeake Bay region, that tidal datum transformation is to MHHW or MLLW. The maximum cumulative uncertainty therefore represents uncertainty, expressed as the standard deviation of the error. If the errors are normally distributed, then 68% of the errors when using VDatum will be smaller than the MCU, and 95% of the errors will be smaller than 1.96 times the MCU. The MCU values for most VDatum regions have been computed and are shown in Table 1. NOAA is actively engaged in updating this methodology, adding new regions of coverage, and in improving the VDatum files for the various existing regions.
Note that the NAVD 88 datum is not available in Puerto Rico or the U.S. Virgin Islands. Therefore, in the uncertainty calculations, we use in its place where appropriate the Puerto Rico Vertical Datum of 2002 (PRVD02) and the Virgin Island Vertical Datum of 2009 (VIVD09).
Table 1. The maximum cumulative uncertainty (cm) for operational VDatum regions.
| VDATUM REGION | MAXIMUM CUMULATIVE UNCERTAINTY |
| Maine, New Hampshire, Massachusetts - Gulf of Maine | 13.4 |
| New York/Connecticut/Rhode Island – Outer NY Bight, eastern Long Island Sound, Block Island Sound | 9.4 |
| New York - The Great South Bay | 9.4 | !--NYgr8bay-->
| New Jersey/New York/Connecticut – Northern NJ, NY Harbor, western Long Island Sound | 9.1 |
| New Jersey - Coastal embayments - North | 9.0 |
| New Jersey - Coastal embayments - South | 6.5 |
| Virginia/Maryland/Delaware/New Jersey - Mid-Atlantic Bight shelf | 6.8 |
| Delaware - Delaware Bay | 6.4 |
| Virginia/Maryland - East Chesapeake Bay | 6.5 |
| Maryland - Northwest Chesapeake Bay | 6.5 |
| Virginia - Southwest Chesapeake Bay | 6.5 |
| Virginia/Maryland/Delaware - Coastal embayments | 6.6 |
| North Carolina – Inland waterways and sounds | 9.9 |
| North Carolina – Coastal shelf | 9.9 |
| Georgia/South Carolina/North Carolina-Sapelo Island GA to Holden Beach NC | 15.5 |
| Florida/Georgia – Shelf, Fort Lauderdale FL to Sapelo Island GA | 10.4 |
| Florida/Georgia – Inland water, Fort Lauderdale FL to Sapelo Is | 11.1 |
| Florida – South Florida, Naples to Fort Lauderdale FL, and Florida Bay | 9.6 |
| Florida – South Florida Inland Waterways | 9.4 |
| Florida – Anclote Key to Naples | 13.0 |
| Florida – Apalachicola to Anclote Key | 10.2 |
| Florida - St. Joseph Bay and the Gulf Coast | 8.6 |
| Florida - St. Andrews Bay and the Gulf Coast | 8.0 |
| Florida - Perdido, Pensacola and Choctawhatchee Bays | 8.3 |
| Florida/Alabama - Gulf Coast from Mobile Bay to east of Choctawhatchee Bay | 8.1 |
| Alabama - Mobile Bay and Perdido Bay | 8.2 |
| Louisiana/Mississippi - Eastern Louisiana to Mississippi Sound | 17.1 |
| Louisiana - Atchafalaya | 6.0 |
| Louisiana/Texas - Intracoastal | 5.5 |
| Louisiana/Texas - Gulf Coast nearshore | 6.2 |
| Texas - Central Intracoastal | 5.9 |
| Texas - Southern Intracoastal | 6.2 |
| Texas/Louisiana - Gulf Coast offshore | 6.6 |
| Texas - Southern Intracoastal | 6.4 |
| California - Southern California | 7.5 |
| California - Southern California Inland | 6.7 |
| California -Monterey Bay to Morro Bay | 8.0 |
| California - San Francisco Bay Vicinity | 7.7 |
| California - San Francisco Bay Inland | 6.5 |
| California/Oregon - Coastal | 7.8 |
| Oregon - Coastal Inland | 6.5 |
| Oregon - Coastal | 7.8 |
| Washington - Coastal | 7.9 |
| Washington - Strait of Juan de Fuca Inland | 6.9 |
| Washington - Strait of Juan de Fuca | 7.2 |
| Washington - Puget Sound | 7.1 |
| Washington/Oregon/California - Offshore | 9.1 |
| Puerto Rico and U.S Virgin Islands (uses PRVD02 and VIVD09 instead of NAVD88) | 7.4 |
| Alaska - Southeast, Yakutat to Glacier Bay | 13.2 |
| Alaska - Southeast, Glacier Bay to Whale Bay | 13.2 |
| Alaska - Southeast, Whale Bay to US/Canada Border | 13.2 |
The methodology developed for Chesapeake Bay can be used for other VDatum regions by substituting the appropriate numerical values. A summary of the accuracy values are shown in the tables below. Table 2 contains transformation values that are the same for all regions, and Table 3 contains values that vary from region to region. Again, please note that NOAA continues to work on refining these estimates and on determining the errors in other VDatum regions.
Table 2. Uncertainty (standard deviation) in transformations and source data (cm) that are constant for VDatum regions. Here the Base datum is NAVD 88 for the continental United States, PRVD02 to Puerto Rico, VIVD09 for the U.S. Virgin Islands, and Alaska. NA means Not Available.
| REGION | TRANSFORMATION | SOURCE DATA | |||||||||||
| ITRFxx to NAD83 | NAD83 to Base | Base to NGVD29 | EGM2008 to WGS84 | EGM1996 to WGS84 | EGM1984 to WGS84 | NAVD88 to IGLD85/LWD | NAD83 | Base | NGVD29 | EGM2008 | EGM1996 | EGM1984 | |
| Continental U.S. | 2.0 | 5.0 | 2.0 | 10.3 | 61.8 | 100 | 20.0 | 2.0 | 5.0 | 18.0 | 11.4 | 68.4 | 100 |
| P.R. and U.S. V.I. | 2.0 | 3.0 | NA | 10.3 | 61.8 | 100 | NA | 2.0 | 2.0 | NA | 11.4 | 68.4 | 100 |
| Alaska | 2.0 | 3.0 | 3.0 | 10.3 | 61.8 | 100 | NA | 2.0 | 2.0 | 18 | 11.4 | 68.4 | 100 |
It should be noted that the uncertainty values in these tables are given on a region by region basis. The values involving water level transformations are based on evaluating the uncertainty at water level stations in those regions. For the regional values, an assumption has been made that the uncertainty at the stations is representative of the uncertainty at locations away from the stations (e.g., in the center of a bay). Work is continuing to better define uncertainty at areas away from the water level stations and this document will be updated as those methods are determined and put into place. Also note the maximum cumulative uncertainty (MCU) is not the maximum error that could be observed. Rather, the MCU is the maximum of the combined standard deviations.
Table 3. Uncertainty (standard deviation) for transformation and source data (cm) for several VDatum regions. ‘MCU’ is the maximum cumulative uncertainty based on the sum of the uncertainties of the ITRFxx-to-NAD83, NAD83-to-NAVD 88, NAVD 88-to-LMSL, and maximum of the tidal datum transformations, and the uncertainties in the NAD 83, NAVD 88 and tidal datum source data.
| REGION | TRANSFORMATION | SOURCE DATA | MCU | ||||||
| NAVD88 to MSL | MSL to MHHW | MSL to MHW | MSL to MTL | MSL to DTL | MSL to MLW | MSL to MLLW | All Tidal Datums | ||
| Maine, New Hampshire, Massachusetts - Gulf of Maine | 7.9 | 6.9 | 7.3 | 4.2 | 4.6 | 6.3 | 6.7 | 1.6 | 13.4 |
| New York/Connecticut/Rhode Island – Outer NY Bight, eastern Long Island Sound, Block Island Sound | 3.9 | 3.0 | 2.8 | 1.3 | 1.2 | 3.0 | 3.2 | 1.5 | 9.4 |
| New York - The Great South Bay | 3.9 | 2.3 | 2.2 | 1.3 | 1.4 | 2.2 | 2.3 | 2.2 | 9.4 |
| New Jersey/New York/Connecticut – Northern NJ, NY Harbor, western Long Island Sound | 3.9 | 2.2 | 2.1 | 0.9 | 1.0 | 2.2 | 2.5 | 1.4 | 9.1 |
| New Jersey - coastal embayment - North | 3.9 | 1.2 | 1.1 | 0.5 | 0.6 | 1.3 | 1.3 | 1.8 | 9.0 |
| New Jersey - coastal embayment - South | 2.4 | 1.2 | 1.2 | 1.2 | 1.2 | 1.2 | 1.3 | 1.8 | 6.5 |
| Virginia/Maryland/Delaware/New Jersey - Mid-Atlantic Bight shelf | 2.4 | 2.4 | 2.2 | 2.2 | 2.4 | 2.3 | 2.5 | 1.8 | 6.8 |
| Delaware - Delaware Bay | 2.4 | 1.0 | 1.0 | 1.0 | 1.1 | 1.1 | 1.1 | 1.3 | 6.4 |
| Virginia/Maryland - East Chesapeake Bay | 2.4 | 1.4 | 1.3 | 1.3 | 1.4 | 1.4 | 1.5 | 1.6 | 6.5 |
| Maryland - Northwest Chesapeake Bay | 2.4 | 1.2 | 1.1 | 1.1 | 1.2 | 1.2 | 1.3 | 1.6 | 6.5 |
| Virginia - Southwest Chesapeake Bay | 2.4 | 1.3 | 1.3 | 1.3 | 1.4 | 1.3 | 1.4 | 1.6 | 6.5 |
| Virginia/Maryland/Delaware - Coastal embayment | 2.4 | 1.7 | 1.6 | 1.7 | 1.8 | 1.8 | 1.9 | 2 | 6.6 |
| North Carolina – Inland waterways and sounds(N) | 4.6 | 3.8 | 3.5 | 1.5 | 1.8 | 2.6 | 2.8 | 1.5 | 9.9 |
| North Carolina – Coastal shelf | 4.7 | 2.7 | 2.6 | 0.5 | 1.0 | 2.9 | 3.7 | 1.5 | 9.9 |
| Georgia/South Carolina/North Carolina-Sapelo Island GA to Holden Beach NC(*) | 9.4 | 7.4 | 7.0 | 2.6 | 2.8 | 9.4 | 9.5 | 1.4 | 15.5 |
Florida/Georgia –Shelf, Fort Lauderdale FL to Sapelo Island GA(*) |
4.1 | 5.4 | 4.6 | 1.9 | 1.7 | 4.4 | 4.3 | 1.4 | 10.4 |
Florida/Georgia – Inland Waterways, Ft Lauderdale FL to Sapelo Island GA(*,N) |
4.5 | 6.1 | 5.5 | 1.4 | 1.7 | 6.2 | 6.4 | 1.4 | 11.1 |
| Florida – South Florida, Naples to Fort Lauderdale, and Florida Bay | 3.0 | 3.3 | 3.2 | 1.1 | 1.6 | 3.3 | 4.4 | 1.8 | 9.6 |
| Florida – Florida – South Florida Inland Waterways | 3.6 | 2.9 | 2.6 | 0.2 | 0.3 | 2.9 | 3.2 | 1.8 | 9.4 |
| Florida – Anclote Key to Naples | 9.8 | 3.1 | 2.7 | 0.7 | 1.3 | 3.0 | 3.2 | 1.7 | 13.0 |
| Florida – Apalachicola to Anclote Key | 3.4 | 5.1 | 4.3 | 1.6 | 2.6 | 3.8 | 5.2 | 1.8 | 10.2 |
| Florida - St. Joseph Bay and the Gulf Coast | 0.2 | 1.3 | 3.2 | 1.4 | 0.3 | 1.0 | 0.9 | 1.8 | 8.6 |
| Florida - St. Andrew Bay and the Gulf Coast | 0.3 | 1.0 | 1.0 | 1.2 | 0.9 | 1.8 | 1.4 | 1.3 | 8.0 |
| Florida - Perdido, Pensacola and Choctawhatchee Bays | 0.6 | 1.7 | 1.6 | 0.5 | 0.4 | 1.7 | 1.8 | 1.8 | 8.3 |
| Florida/Alabama - Gulf Coast from Mobile Bay to east of Choctawhatchee Bay | 0.0 | 0.1 | 0.6 | 0.0 | 0.1 | 0.6 | 0.3 | 1.9 | 8.1 |
| Alabama - Mobile Bay and Perdido Bay | 0.0 | 1.7 | 1.1 | 0.3 | 0.4 | 0.9 | 1.1 | 1.8 | 8.2 |
| Mississippi/Louisiana - Mississippi Sound to western Louisiana | 14.8 | 2.4 | 2.3 | 0.8 | 1.0 | 2.4 | 2.9 | 1.9 | 17.1 |
| Louisiana - Atchafalaya | 3.0 | 1.6 | 1.4 | 1.0 | 1.2 | 1.5 | 1.7 | 2.0 | 6.0 |
| Louisiana/Texas - Intracoastal | 1.9 | 1.5 | 1.2 | 0.9 | 1.1 | 1.4 | 1.6 | 2.0 | 5.5 |
| Louisiana/Texas - Gulf Coast Nearshore | 3.2 | 1.8 | 1.5 | 1.1 | 1.3 | 1.7 | 2.0 | 2.0 | 6.2 |
| Texas - Central Intracoastal, | 3.0 | 1.4 | 1.2 | 1.0 | 1.1 | 1.4 | 1.5 | 2.0 | 5.9 |
| Texas - Southern Intracoastal | 3.3 | 1.7 | 1.4 | 1.1 | 1.2 | 1.6 | 1.8 | 2.0 | 6.2 |
| Texas/Louisiana - Gulf Coast offshore | 3.8 | 2.2 | 1.8 | 1.4 | 1.6 | 2.1 | 2.4 | 2.0 | 6.6 |
| Texas - Gulf Coast Nearshore, | 3.4 | 2.0 | 1.7 | 1.3 | 1.5 | 1.9 | 2.2 | 2.0 | 6.4 |
| California - Southern California | 2.7 | 3.0 | 2.7 | 1.5 | 2.1 | 3.0 | 4.2 | 1.3 | 7.5 |
| California - Southern California Inland | 2.7 | 1.4 | 1.3 | 1.0 | 1.3 | 1.7 | 2.4 | 1.3 | 6.7 |
| California -Monterey Bay to Morro Bay | 2.7 | 3.6 | 3.1 | 1.7 | 2.4 | 3.5 | 4.9 | 1.4 | 8.0 |
| California - San Francisco Bay Vicinity | 2.6 | 3.4 | 3.0 | 1.6 | 2.3 | 3.3 | 4.6 | 1.4 | 7.7 |
| California - San Francisco Bay Inland | 2.9 | 1.2 | 1.1 | 0.7 | 0.9 | 1.2 | 1.6 | 1.4 | 6.5 |
| California/Oregon | 2.7 | 3.5 | 3.0 | 1.7 | 2.3 | 3.4 | 4.8 | 1.2 | 7.8 |
| Oregon - Coastal Inland | 2.7 | 1.4 | 1.3 | 1.1 | 1.3 | 1.5 | 2.0 | 1.2 | 6.5 |
| Oregon - Coastal | 2.5 | 3.5 | 3.1 | 1.7 | 2.4 | 3.4 | 4.8 | 1.2 | 7.8 |
| Washington - Coastal | 2.6 | 3.4 | 3.0 | 1.7 | 2.3 | 3.3 | 4.7 | 1.6 | 7.9 |
| Washington - Strait of Juan de Fuca Inland | 3.1 | 1.3 | 1.2 | 1.0 | 1.5 | 1.9 | 2.5 | 1.4 | 6.9 |
| Washington - Strait of Juan de Fuca | 3.0 | 2.6 | 2.3 | 1.5 | 1.7 | 2.7 | 3.4 | 1.4 | 7.2 |
| Washington - Puget Sound | 3.7 | 1.4 | 1.3 | 0.9 | 1.1 | 1.4 | 1.9 | 1.5 | 7.1 |
| Washington/Oregon/California | 3.0 | 4.6 | 4.1 | 2.2 | 3.1 | 4.5 | 6.4 | 1.6 | 9.1 |
| Puerto Rico and U.S. Virgin Islands - Islands | 2.9 | 1.5 | 1.5 | 0.6 | 0.5 | 1.4 | 1.4 | 1.5 | 6.6 |
| Puerto Rico and U.S. Virgin Islands - Offshore | 4.4 | 1.5 | 1.3 | 0.6 | 0.7 | 1.3 | 1.5 | 1.5 | 7.4 |
| Alaska - Southeast, Yakutat to Glacier Bay | 8.0 | 6.6 | 6.5 | 1.4 | 1.6 | 5.0 | 6.0 | 2.1 | 13.2 |
| Alaska - Southeast, Glacier Bay to Whale Bay | 8.0 | 6.6 | 6.5 | 1.4 | 1.6 | 5.0 | 6.0 | 2.1 | 13.2 |
| Alaska - Southeast, Whale Bay to US/Canada Border | 8.0 | 6.6 | 6.5 | 1.4 | 1.6 | 5.0 | 6.0 | 2.1 | 13.2 |
(*) Tidal datum error values obtained by jackknifing. (N) This region contains non-tidal areas. |
|||||||||
Accuracy of the Transformations
Accuracy in the various transformations has been studied in a variety of ways. The Ellipsoid-to-NAD 83 transformations are carried out by the employment of accurate, multi-parameter mathematical equations so that only a small error results. However, the NAD 83 datum realization is constantly being updated (most recently in 2007 [Pursell, 2007]); here we assume a nationwide SD value of 2.0 cm [Mader et al., 2003] to represent the uncertainty in all ITRFxx, World Geodetic System of 1984 (WGS 84), and other multi-parameter ellipsoidal transformations. The NAD 83-to-NAVD 88 transformation is accomplished by a variety of gridded geoid models such as GEOID99 and GEOID03. GEOID03 is estimated to have an SD nationwide of 2.4 cm [Roman et al., 2004], and the older gridded geoid model GEOID99 is estimated to have an SD nationwide of 4.6 cm [Roman et al., 2004]. Since the NAD 83 readjustment of 2007, GEOID03 error is estimated to have increased nationwide [Roman, personal communication]. Thus we take a conservative value of 5.0 cm for this transformation for all coastal regions of the continental U.S. The uncertainty in the transformation between NAD 83 and either PRVD02 or VIVD09, utilizing the GEOID12A model, is 2.0 cm (Dan Roman, personal communication. See also https://geodesy.noaa.gov/GEOID/GEOID12A). The NAVD 88-to-MSL transformation is made by another gridded data field, but one specifically designed for each specific coastal region. From a set of comparisons of model-determined datums against observed datums, the SD of error in the Chesapeake Bay region, for example, was found to be 3.4 cm [Accuracy of the Topography of the Sea Surface Transformation].The MSL-to-MHHW transformation is also done by a gridded data set, as are the other tidal datum transformations. From a set of comparisons of hydrodynamic model-determined tidal datums against observed datums, the SD of MHHW error in Chesapeake Bay region was found to be 3.1 cm [Accuracy of the Tidal Transformation]. Errors in the other tidal transformations for Chesapeake Bay, which range from 1.5 to 3.1 cm, are shown in the figure, and in Table 3.
As an example, the propagation of uncertainty using the Chesapeake Bay data (Table 3) and VDatum to convert an ITRF2000 value to a MHHW value is based on the uncertainties of each transformation. If each transformation process is independent of any other process (a reasonable assumption, given the disparity of the data types and sources), then the standard deviation of the uncertainty of the entire process is the square root of the sum of the squares of the individual SDs, which, from ITRFxx to MHHW, is 8.4 cm. This transformation uncertainty is the square root of the sum (2.0^2 + 5.0^2 + 3.4^2 + 3.1^2) = 50.17, or 7.08 cm. We note that if the processes are not independent of each other, then the total uncertainty can be almost 50% larger. Transformation uncertainties for other regions can be estimated using the values in Tables 2 and 3.
Accuracy of the Source Data
We assume that the initial datum value provided by the user has zero uncertainty. In particular, we assume that, if an ellipsoidal coordinate frame such as ITRFxx or WGS 84 has been used to obtain data via GPS, no error has been introduced. NAD 83 is a mathematical surface defined by an ellipsoid with origin at the Earth’s mass center. Following established guidelines [Zilkoski et al., 1997], measurements are accurate to about 2 cm nationally. NAVD 88 is determined by geodetic leveling; its vertical precision nationwide is approximately 5 cm [Zilkoski et al., 1992]. This does not include any systematic errors such as untracked subsidence. Finally, the MSL and the other tidal datums each have an SD of 1.6 cm in the Chesapeake Bay region [Accuracy of the Tidal Datums]. Tidal datum uncertainties for other regions can be estimated using the values in Table 3. The PRVD02 and VIVD09 vertical datums are determined by the GEOID12A model. According to NGS, the source data uncertainty is 2 cm for PRVD02 and VIVD09 (Tim Hanson, personal communication).
Since the sources of data are distinctly different, the errors are assumed to be reasonably independent. Therefore, if a user is making transformations from an ellipsoid-based three-dimensional reference frame to a tidal datum such as MLLW, the uncertainty due to the source data is estimated as the square root of the sum of the squares. Using the data uncertainty estimates above for Chesapeake Bay, this total data uncertainty will be the square root of the sum of the individual uncertainties (2.0^2 + 5.0^2 + 1.6^2 + 1.6^2) = 34.12, or 5.84 cm. Total uncertainties in the source data for other regions can be estimated using the values in Tables 2 and 3.
Other Consideration
These errors are affected by a variety of factors, including variations in the tidal range, tidal phase differences, bathymetric and coastal features, the density and proximity of nearby geodetic and tide stations used in the corrections. NOAA is currently investigating better approximations of these spatially varying errors. Please keep in mind that the larger errors in this domain were more likely to be seen in upstream river environments, marshes, and areas where the tides may change more rapidly.
Accuracy of Transformation between NAVD 88 and NGVD 29
For transformations between NAVD 88 and the National Geodetic Vertical Datum of 1929 (NGVD 29), VDatum uses the VERTCON3 model developed by NOAA's National Geodetic Survey (see https://www.ngs.noaa.gov/TOOLS/Vertcon/vertcon.html). VERTCON3 can be considered accurate at the 2 cm (1.0 SD) level [Mulcare, 2004]; it is suitable for a variety of mapping and charting purposes. As a model, it cannot maintain the full vertical control accuracy of geodetic leveling. Users needing high accuracy should adjust their observations using published NAVD 88 values. In rare cases, local distortions of 20 cm or more were found in the NGVD 29 network. The existence of these distortions can be determined by performing transformations around the project area. If dramatically different transformations are obtained over a small area, the presence of a problem NGVD 29 line is indicated. Users encountering these problem lines should contact NGS for further assistance.
As for the NGVD 29 data itself, it was reported [Zilkoski et al., 1992] that significant differences in the values occurred when the datum was recreated by NGS using the original data, but constraining the interpolation to match at 26 tidal stations. A plot of sample differences indicates that the values ranged from -27 to 59 cm. Uncertainties for the transformation involved with VERTCON3, are estimates derived from the VERTCON 3.0 release 20190601 transformation program, for consistency purposes between NCAT and VDatum. In addition, NGVD 29 data are particularly sparse when compared with NAVD 88. The transformation between these two datums is best known where the two sets of leveling data (for each datum) overlap, but errors are expected (and cannot easily be quantified) where NGVD 29 data does not exist.
Accuracy of the Topography of the Sea Surface Transformation
The uncertainty in the topography of the sea surface (TSS) transformation between NAVD 88 and local MSL is derived by combining the uncertainty in the NAVD 88 height transformations at tidal bench mark locations (SD-heights ) and the uncertainty in the interpolation of height values between stations (SD-interpolation). The total uncertainty (SD-tss) in the topography of the sea surface is therefore:
In order to determine the uncertainty in the NAVD 88 height transformations at tide stations, SD-heights, we examine the differences between the accepted NOAA values and the values interpolated using VDatum at the same location. The uncertainty is determined as the SD of the differences. For the Chesapeake Bay regional TSS grid, SD-heights = 2.3 cm.
To evaluate SD-interpolation, the uncertainty in interpolating between NAVD88 and local MSL using the gridded data, a methodology was used whereby each individual tide station was selectively removed from the interpolation. The difference at each tide station between the interpolation results with and without that station was then used as a measure of how much the results could vary in relation to data availability. While this method also reflects the importance of a station and/or station density, we felt that the results obtained with this approach serves as a measure of the overall interpolation accuracy. The uncertainty measure is defined as the SD of the differences, and was computed in the Chesapeake Bay to be SD-interpolation = 2.5 cm.
Therefore, the total topography of the sea surface transformation uncertainty is computed, for the Chesapeake Bay, as SD-tss = {(2.3 cm)^2 + (2.5 cm)^2}^1/2 = 3.4 cm. The combined uncertainty for other regions is shown in Table 3 as the NAVD88 to MSL uncertainty.
Accuracy of the Tidal Transformation
The development of tidal datums for VDatum consists of four steps: (1) modeling the tides and computing tidal datums from the modeled time series, (2) determining model-data differences at tidal bench mark locations, (3) spatially interpolating these differences and adding these back on to the original model results, and (4) interpolating the corrected tidal datum fields from the tide model grid to a structured “marine grid” used by the VDatum software. Step (3) above ensures that the corrected model datums match those computed from observations at NOAA locations. There may be some stations that are not included in this correction process, as they may be located outside of the domain of the tide modeling grid. At stations where the model has been corrected, errors in the tidal datums should be equivalent to errors in computing the datums from observations[Tidal Datum Accuracy].
At locations away from those NOAA observations used in the corrections to the tidal datum fields, it is more difficult to determine errors. These errors are affected by a variety of factors, including variations in the tidal range, tidal phase differences, bathymetric and coastal features, the density and proximity of nearby stations used in the corrections, and more. NOAA is currently investigating better approximations of these spatially varying errors. These methods include selective removal of data to determine the sensitivity of the corrected fields and various spatial interpolation methods that are guided by the results of the underlying hydrodynamic model of the tides.
To best approximate the tidal datum transformation uncertainties at the present time, though, the preferred approach is to compute the standard deviations of the differences between the tidal datums computed from the model and from the observations. Statistics on these errors can provide the user with a sense for what the errors could potentially be at locations away from the stations. For the Chesapeake Bay, these values were 3.08 cm for MLLW, 2.85 cm for MLW, 3.11 cm for MHHW, 2.59 cm for MHW, 1.51 cm for MTL, and 1.76 cm for DTL. Uncertainties for other regions can be estimated using the values in Table 3. The mean value of the model-data differences are assumed to be removed in the final tidal datum fields provided with the VDatum software, as a spatially varying field of model-data differences is used to correct the original model results.
Note that some of the VDatum tidal transformation files were not generated entirely with the input of hydrodynamic models, but were generated solely or in part by spatial interpolation. In those cases, the methodology of station subtraction (i.e., jackknifing), as discussed in the previous section on SD interpolation, was used to estimate the uncertainties. Also, in the Georgia/South Carolina region, numerous new tide stations were added in the 2014 update, and of these approximately 20 were located in the upper reaches of small rivers. Since jackknifing does not appear to give reliable error values for these stations when determining the datum error for the region, the error value at the 20 individual stations at the upper ends of rivers was replaced with the value at the next downstream station.
Some areas of the country, usually in coastal lagoons with limited connection to the ocean, have small or non-existent tidal variations. These areas are defined as ‘non-tidal’, and have a mean tide range of less than 9 cm. Since the tide range is so small, often another datum is used for bathymetric purposes. One such datum is the Low Water Datum (LWD), and is defined as one-half foot (15.24 cm) below MSL. Within non-tidal areas, the VDatum software will not accept a transformation to a regular tidal datum, but only to the LWD.
Please keep in mind that the larger model-data errors in any coastal domain were more likely to be seen in upstream river environments, marshes, and areas where the tides may change more rapidly.
Accuracy of the Tidal Datums
Tidal datum elevations are computed from time series of observed tides at tide stations. By legal definition used by NOAA, tidal datum elevations are computed relative to specific 19-year time periods called National Tidal Datum Epochs (NTDEs). The current official NTDE is the 1983-2001 time period. An example of a tidal datum is Mean Lower Low Water (MLLW) which is the average elevation of the observed lower low tides over a NTDE. MLLW is the NOAA nautical Chart Datum reference for chart products and predicted tides. Another example is Mean High Water (MHW) which is the average elevation of all the high tides over a NTDE. MHW is typically used to represent the coastal shoreline in many mapping products.
NOAA manages a nation-wide network of long-term continuously operating water level stations called the National Water Level Observation Network (NWLON). For many of these stations, tidal datum elevations were computed directly by performing the averaging over the 1983-2001 NTDE. For practical application, the error in datum elevation for these “first-reduction” averages is zero, by definition. However, tidal datum elevations have been determined from thousands of short – term tide stations along the coast that were in for time periods much less than 19-years; typically only for 3-months to a year, depending on the project or application. NOAA accepted procedure is to compute equivalent NTDE tidal datums at these short-term stations by performing a comparison of simultaneous observations with an appropriate NWLON control station. This correction process results in an error in the tidal datum elevations because they were not based on full NTDE. These errors are a function of the distance between short-term station and the control; of the difference in time of high and low waters between the short-term station and the control; and, of the ratio of the mean ranges of the tide between the short-term and control stations. Thus the errors will be spatially variable depending on the number and density of good NWLON stations and on the complexity of the tidal hydrodynamics.
These errors in tidal datum elevations are determined uniquely for each tide station. In the Chesapeake Bay VDatum region, there are 216 stations with a mean standard deviation, for each tidal datum, of 1.57 cm. Uncertainties for other regions can be estimated using the values in Table 3.
References
Mader, G. L., N. D. Weston, M. L. Morrison, and D. G. Milbert, 2003. NGS Geodetic Tool Kit, Part II: The On-Line Positioning User Service (OPUS). See https://www.ngs.noaa.gov/TOOLS/Professional_Surveyor_Articles/OPUS.pdf. 6 pp.
Mulcare, D.M., 2004. NGS Toolkit, Part 9: The National Geodetic Survey VERTCON Tool. See https://www.ngs.noaa.gov/TOOLS/Professional_Surveyor_Articles/VERTCON.pdf
Pursell, D., 2007. National readjustment. See https://www.ngs.noaa.gov/NationalReadjustment/Library/FGCS.2.14.07.presentation.ppt.
Roman, D. R., Y. M. Wang, W. Henning, and J. Hamilton, 2004. Assessment of the new national geoid height model, GEOID03. 2004 ACSM/TAPS Conference and Technology Exhibition, Nashville, TN. 14 pp. Available in https://www.ngs.noaa.gov/GEOID/geolib.html.
Zilkoski, D. B., J. H. Richards, and G. M. Young, 1992. Results of the general adjustment of the North American Vertical Datum of 1988. Surveying and Land Information Systems, Vol. 52(3), pp 133-149. See https://www.ngs.noaa.gov/PUBS_LIB/NAVD88/navd88report.htm.
Zilkoski, D. B., J. D. D’Onofrio, and S. J. Frakes, 1997. Guidelines for establishing GPS-derived ellipsoid heights. NOAA Technical Report NOS NGS 58. 23 pp. See https://www.ngs.noaa.gov/PUBS_LIB/NGS-58.pdf